
Being the thought leaders in their field, they are constantly changing and updating their algorithm to provide the best experience for users. As a digital marketer or more broadly, someone who relies on the digital world for leads, brand awareness or conversions, it is important that you are aware of these changes and adjust your strategy accordingly.
One such change was Google moving to a mobile-first index last year. This means that Google will now index and rank your site based on the content the user will experience on your mobile site, whereas before Google would index and rank based on the desktop experience. Therefore, it makes sense that Google is consistently releasing new tools to help you better understand the importance of mobile and how it can impact your business.
Here I’ll look at the two new tools Google released last week – Mobile Speed Scorecard and Impact Calculator. You can access them here. I’ll show you what they are, how to use them and why they are useful.
Mobile Speed Scorecard
First, let’s look at the Mobile Speed Scorecard.
Google recommends that a site should load within five seconds on mobiles with 3G connections, and within three seconds for those on 4G connections.
Similar to Google’s updated PageSpeed tool, simply input your domain into the tool and it will give you a metric for page load speed. However, there are key differences including:
- Comparing Your Site Speed to Competitors
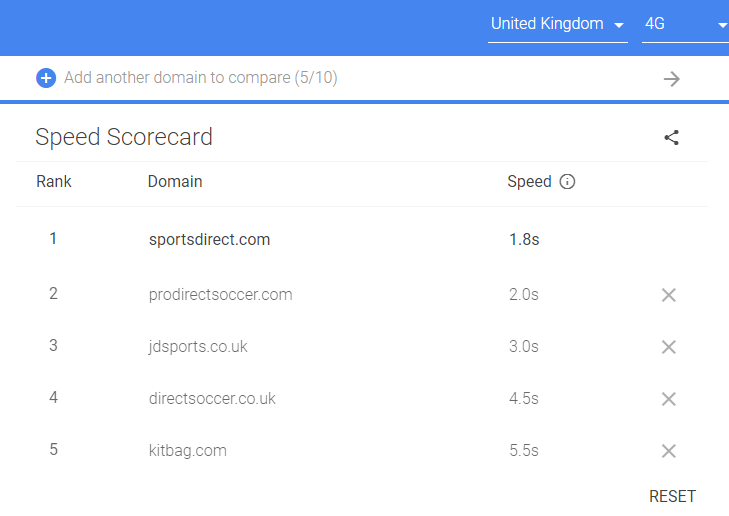
The tool will compare up to ten domains for you, and rank them fastest to slowest. This is a great way to carry out competitor research, easily allowing you to see which of your competitors are ahead of you when optimising for mobile site speed.
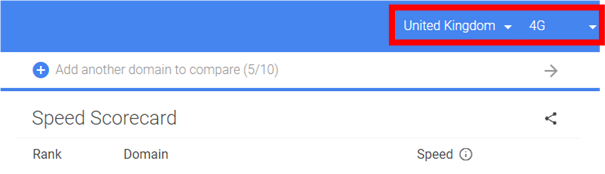
- Select Country & Connection Speed
Another feature of the tool that goes further in-depth than the PageSpeed Insights, is you can select which country and speed of connection to test your site speed on. This means you can be more specific and targeted in your research. Select from 12 countries including:
- Australia
- Canada
- France
- United Kingdom
- United States
Then select whether you would like to test on 3G or 4G.
Be warned: the data you receive from this tool is a top-level score. It does not let you dive deeply into why a page is slow or which pages on your website are slower than others, nor the technical reasons behind the speed. But it does help you to understand which of your competitors are ahead or behind in mobile optimisation.
If your site is significantly slower than the rest of your competition, it is worth addressing the issue sooner rather than later.
Potential Revenue Impact
One of the main reasons why you should be concerned about your site speed on mobile is addressed in the second tool Google has released. The Potential Revenue Impact tool is more complex than the Mobile Speed Scorecard, but gives you more valuable data. To gather the data for the tool, you will need to have Google Analytics set up for your site. Fortunately, most sites have this analytics tool in place already.
Potential Revenue Impact’s primary function is to demonstrate how much money you are losing from poor mobile site speed and the positive impact small improvements can make to the bottom line. To discover this, you will need the following four metrics:
- Current Speed
This is the easiest to find and is automatically entered through from the Mobile Speed Scorecard.
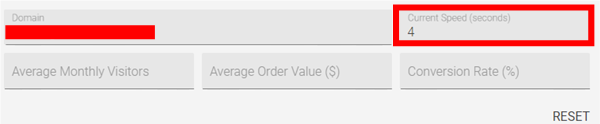
N.B. The example I am using is a large ecommerce site.
2. Average Monthly Visitors
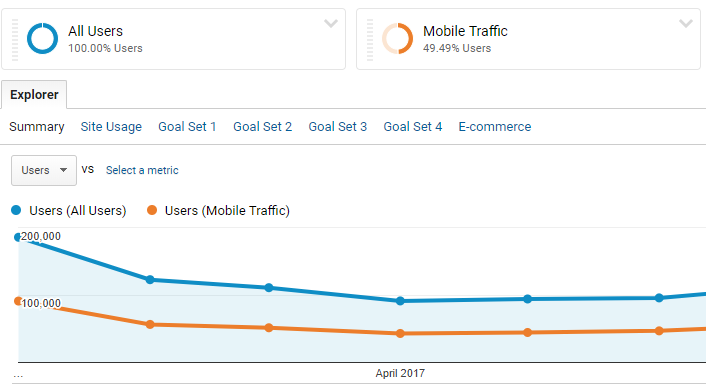
This metric requires using Google Analytics, but is also easy to find. Navigate to Audience > Mobile > Overview. Here you will find the metric for the total number of users visiting your site via mobile.
Set your date range on Google Analytics to a year or longer – the longer the date range, the more reliable your set of data will be.
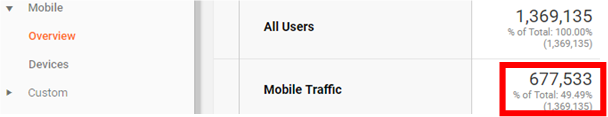
It is important to organise your data by adding Mobile Traffic as a segment. Then, simply take the number and divide it by the number of months in the date range. The example I am using is over 12 months, so the average monthly visitors on this site = 56,461.
The graph in Google Analytics will give you a month-by-month breakdown of mobile users visiting your site, seen here.
3. Average Order Value
If you are not comfortable with Analytics, this is the most difficult to find but I will highlight how to find it for your site.
Click on Conversions > E-commerce > Overview. Then, exactly how we found the Average Monthly Visitors, you select your date range and add your Mobile Traffic segment to your data.
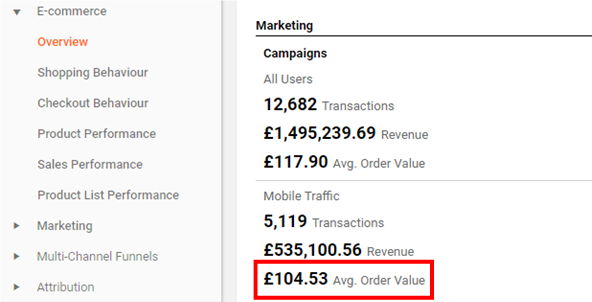
This is one of the most useful metrics an ecommerce site can analyse. Understanding Average Order Value signposts certain trends in your sales.
- Consumers Not Buying Multiple Items
- Why are your customers buying only one item? Can you be doing anything to encourage multiple purchases?
- Understand Which of Your Items Are Popular and Which Are Not
- If the average order value is low, then it means your cheaper, smaller items are your top sellers. Why is this? Can you market your more expensive items better?
Don’t forget to convert your value into dollars before you put the data into the tool.
Finally, the last metric:
- Conversion Rate (%)
This information can be found on the same page as Average Order Value and indicates what percentage of your mobile traffic is converting into a sale.
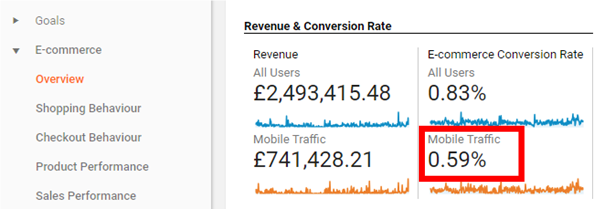
If your conversion rate on mobile is particularly low, it is important to audit why that might be. Perhaps your landing page is not responsive to mobile, or has a poor user experience. Your checkout page might not be mobile friendly and is causing users to abandon their purchase at the last stage. For more information on creating a digital strategy for mobile, our Managing Director Susan Hallam MBE has written a fantastic checklist here, detailing everything you need to know.
Now we have all four metrics and understand why each is important, we can input this into the Impact Calculator.
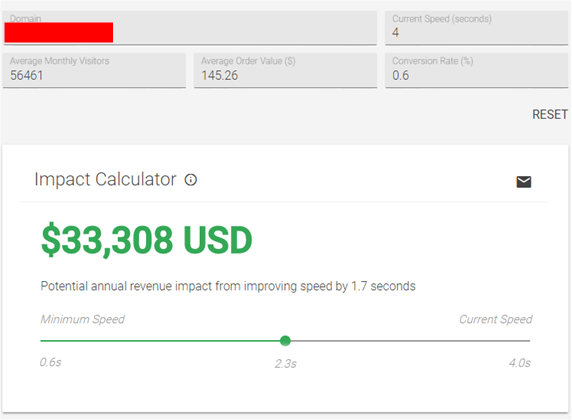
Here we can see that by improving the mobile site speed by 1.7 seconds, this site can save around $33,308 per year. That equates to around £24,000!
Final Thoughts
From Panda to Penguin, Google will always stay one step ahead with their updates. Therefore, it is important to react to the changing landscape, and right now mobile is only going to get more significant.
These tools help demonstrate that improving mobile site speed does not just improve user experience, or something that digital marketers suggest for SEO. Faster mobile site speed increases conversions and brings in significantly more revenue for your business.
Whether you are trying to convince your financial director into giving you a larger digital marketing budget or if you are just wanting to see how your site compares to your competitors, give these two tools a try and see how they can help you.
For more help with your SEO strategy, get in touch with us today.