
 Never make an important decision without checking the facts beforehand.
Would you bungee jump without checking the cord first? Cross the road without first looking for traffic? Or change a live fuse without checking the power is turned off?
Making a decision without first checking facts can end up being very costly, yet we often see this happen in the digital marketing sector.
How Statistics Can Lie To You
When looking into statistical differences, trends and causalities, if you don’t have enough information it’s easy to get the wrong picture.
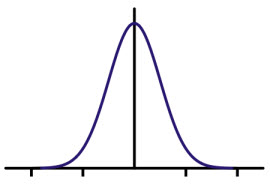
Consider a simple coin toss: Flipping a coin ten times may land the coin six times on heads and four times on tails. Does this mean that a coin toss returns heads 60% of the time? You would need to flip a coin many more times to get a clear picture of how likely it is to turn up heads.
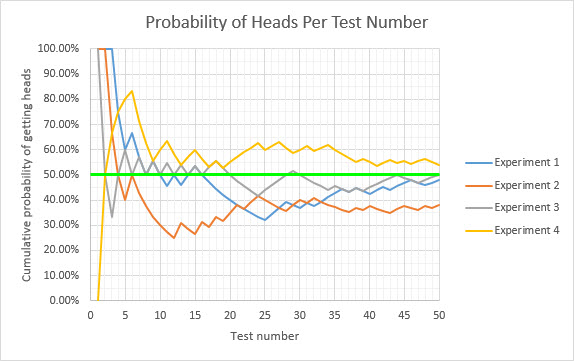
Plotting a few simulations of coin tosses on a chart shows that even after 50 coin tosses you may be far away from the true answer of 50% probability:
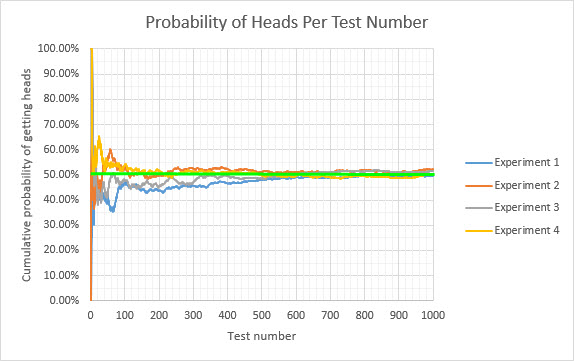
Even after 1,000 coin tosses the answer can be often found between 48%-52% which is ±2% around the actual answer:
Without a large number of tests there is no way you can tell what the real answer is, and it would be foolish to make conclusions without being scientific and getting enough facts before making a conclusion.
Tabloids often use inconclusive or skewed statistics to back up elaborate claims such as “Drinking X Cures Cancer!“, “Vitamin X Reverses Baldness!” or “Eating X Will Make You Lose Weight!“. You can easily make these claims simply through having such a small testing group that you have “noisy” data, statistics so inconclusive that they may swing either way and prove what you want to prove if you are lucky enough. A famous case of this was from John Bohannon, who fooled millions of people and major publications into thinking chocolate aided weight loss.
Filtering out test subjects also can skew statistics wildly. For example, many hair care product marketers will interview customers who have already bought the product, been given the product for free or who have shared an interest in the product in the past. They are then asked if they would recommend the product to their friends or family. The results are unsurprisingly positive with results commonly topping over 80% approval rating which can then be added to marketing material with an impressive number of test subjects.
How Low Statistical Significance Can Result in Bad Digital Marketing Decisions
 A lot of digital marketing work begins with some basic decisions – What should we spend time testing? Which tasks need performing first? We then identify the results generated from any changes made.
Let’s look at three areas of digital marketing where low statistical significance can have a negative impact overall, despite the marketers’ best efforts to improve things:
Incorrect Changes Made in Online Paid Advertising Accounts
With paid advertising you are putting up your own money in advance of getting a return on the investment. The risk of losing money overall is a cause of concern for most online business owners, which can lead to some rash decisions within online paid advertising accounts.
For example, it’s very easy to look at a campaign’s statistics, think that it’s not performing as well as expected, and delete that campaign so it no longer ‘wastes’ any advertising costs. But if the campaign was set up to correctly target the right people, then it’s very unlikely to be worthless. Often there simply haven’t been enough clicks to see if it could make any sales. If one sale was made for every fifty clicks, then it would be a rash decision to give up on a campaign which has had less than 100 clicks, as it might have just been unlucky not to have made a sale.
Before making decisions within paid advertising you need to consider three things:
- Has there been enough traffic (enough test subjects)?
- Have there been enough conversions (enough test goals)?
- Is the data skewed in any way?
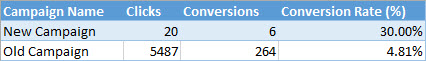
Looking at paid advertising statistics without enough traffic could lead you to believe that something is much better than it really is. For example, shown below is data from different campaigns where one campaign was lucky enough to have six conversions within only twenty clicks. This could lead the account manager to think that this campaign is worth spending a lot more money on when in fact it may perform similarly to the other campaigns with more traffic:
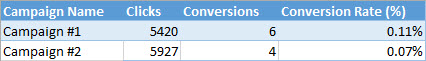
With low numbers of conversions you many not have an idea of how well paid advertising is performing unless you get significantly more traffic again. This could be due to not enough time passing to get enough data or a low conversion rate which requires a huge number of visitors to get one conversion on average:
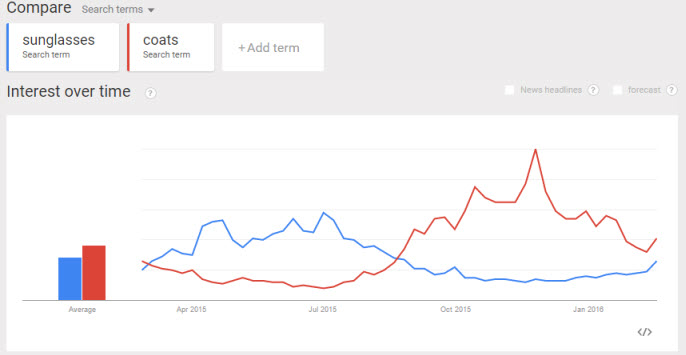
One last consideration is to think about how statistics might be skewed within different date ranges or with different segments of people advertised towards. There can be some big seasonal changes which may skew statistics. For example, look at how many Google searches there are for “sunglasses” vs. “coats” last year in the UK:
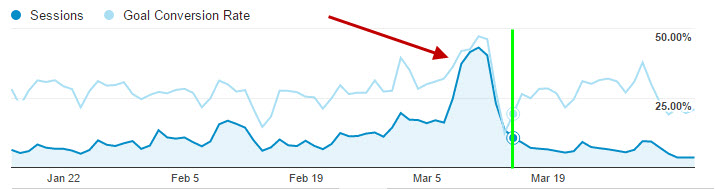
Below is real traffic data for a website selling delivered flowers online. Note that the number of clicks increases as well as the conversion rate – the likelihood of a sale – a few days before Mother’s Day last year, which occurred on Sunday March 15:
So to get around all these issues when optimising paid advertising accounts you need to have enough traffic and conversions before you make any big decisions. Also keep in mind that you may be looking at skewed data.
If you don’t have enough traffic or conversions then you could instead look at website metrics such as pages per session or average session duration to see how engaged the visitors are through different channels. This allows you to make decisions quicker but you will still need a good proportion of clicks before you can start getting a clearer picture.
If there is a positive or negative seasonal trend, then try to look at statistics around that period or take statistics from the same period last year if you have them to hand.
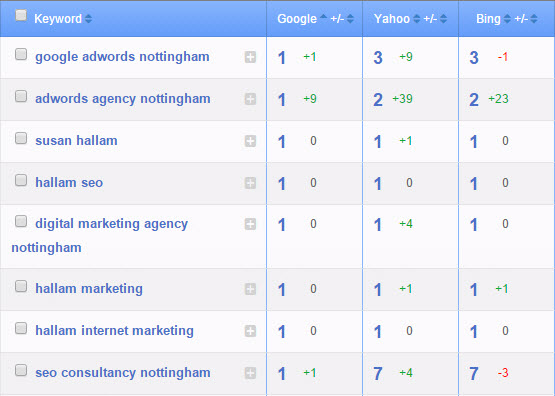
Incorrect Assumptions About Search Engine Rankings
Search engine optimisation (SEO) is a complex topic with a lot of people believing many SEO myths and using bad practices to try and out-rank competitors in search engines.
We sometimes hear talk that a certain change to a website or a certain external link towards a website has resulted in a good or bad effect on SEO. Statements such as “We got a link from X website and saw an X% rise in sales” or “We changed X on the website and then lost X amount of traffic each month” can lead to strong beliefs that certain SEO tactics must be good or detrimental to overall traffic or sales.
Search engine rankings are dependant on hundreds of factors, a combination of many differently-weighted signals to determine which pages out of millions of potentially relevant pages online to place in order at the top of the results. Ranking increases or decreases could be down to many different reasons which may not be related to any SEO activity, such as:
- A powerful website removed from the internet could boost rankings to websites below it
- A new powerful competitor could reduce everyone’s rankings by taking up the number one position
- Google may deem a certain SEO ranking factor more or less important than before
- A competitor may gain or lose external backlinks, which play a large role in SEO
- Trending news or videos on a topic may appear above the natural search engine listings one day
These are just some of the many ways external forces might effect a website’s rankings without making any change to the website itself. So it may be a complete coincidence that a certain change had a good or bad impact on SEO unless there are very large amounts of data to back up the claims.
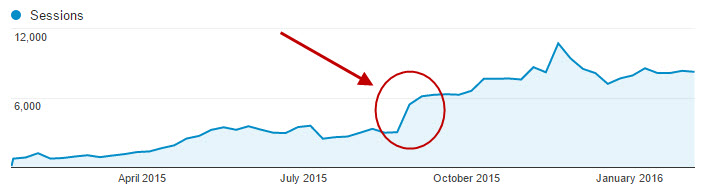
It’s important to know the difference between causation and correlation in statistics. If you have a high traffic website then simply looking at a graph showing the number of organic sessions can reveal a big change:
If you don’t have a large amount of traffic, then just use the best SEO and usability practices on your website and get an expert to do a full website review to double check that everything is in place.
Ending Split Tests Before The Test Has Run its Course
A/B or multi-variant split testing can again require massive amounts of traffic before a winning variation can be found. Luckily the complex mathematics behind statistical significance is automatically calculated in all major split testing software:
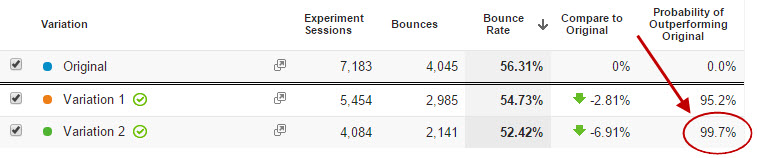
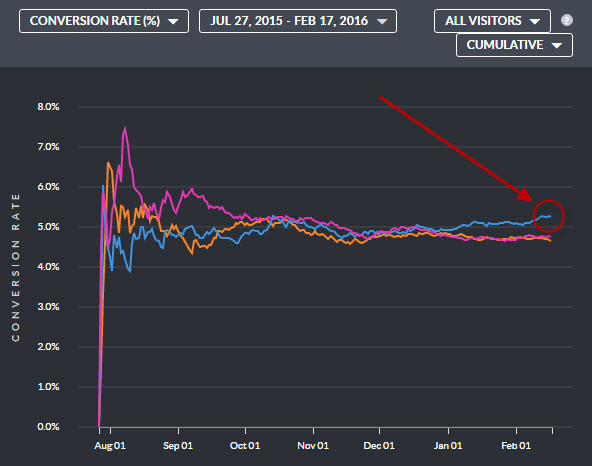
In a rush you could end the experiment with an 80%-90% certainty that one variant is better than another according to the statistics shown. We have seen split tests determine that one variation is over 90% certain to win, only for it to actually lose overall when enough data is collected:
I would always recommend waiting until the results are over 99% significant before coming to a potentially wrong conclusion. If the website were changed to the worse variant, it could be a permanent step backwards in terms of how well it can convert.
 You can risk going to only a 95% certainty if traffic levels are low, but remember that there’s a 5% risk that you’re looking at a false negative – 1 out of 20 times the results will be the opposite what is reported.
Below are a few to quick tips for split testing with low levels of traffic:
- Test big changes first as these are most likely to product different conversion rates and end the overall experiment quicker
- Start split testing web pages as early as possible, it can take under an hour to set up using tools such as Visual Website Optimiser (user friendly, pay to use) or Google Content Experiments (requires development, only A/B/N testing, free to use)
- Test different stages of your website at the same time – for an ecommerce website you could be testing the homepage, category pages, product pages, cart page, checkout page and success page all at the same time and have compound conversion rate percentage improvements
If your traffic levels are large enough then why not test to a 99.9% certainty? You can even segment a small percentage of visitors to test on so the overall results don’t have too much of an impact if the experiment produced worse results that the original variant.
Conclusion
Gather as much information as you can before making digital marketing decisions based on statistics, which usually requires lots of test subjects (visitors). Garbage in results in garbage out when it comes to statistics, so don’t fool yourself into taking potentially a harmful action unless you are very certain things are changing for better or for worse.
How Statistical Significance Underpins Digital Marketing – https://t.co/0xhxsqHJNl #ppcchat
— Jonathan Ellins (@Jonathan_Ellins) 25 February 2016